
Everybody loves a good infographic. Need to summarize a complex set of statistics (like, say, alternate band names for Pussy Riot)? Try a pie chart. When scientists have trouble understanding data, they use 3-D imaging to map the invisible patterns of airplane turbulence or visualize how a woman’s hair might rumple if she uses X Brand of shampoo, as illustrated inDiscovery Magazine.
But how do you portray invisible occurrences that are not data-driven? What are my options if I want to visualize the emotional ups and downs of my new favorite song, or understand the subjective history of a public space? Can I get an infographic of some feelings over here?
Here are five artists who are making the invisible easier for us to see.

Music: Andrew Kuo
Andrew Kuo makes infographics based on unreliable information. His minimal, brightly colored graphs chart the unchartable, with a particular focus on music: he might rank the emotions of Kanye West’s “Robo Cop” in comparison to other "great" break-up songs, or plot his reaction to a new 9-minute Joanna Newsom single. If music really is just another kind of math, I want Kuo to be my trigonometry teacher.
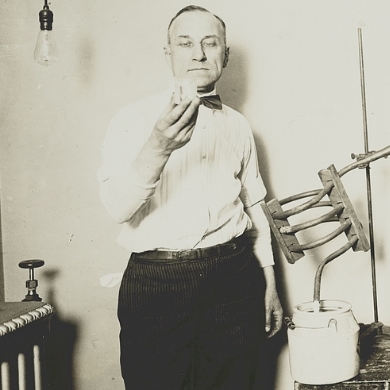
Motion: STREB
Choreographer Elizabeth Streb approaches dance like a scientific experiment. In performance and at her Williamsburg "lab," STREB dancers test the invisible laws of motion by throwing their bodies against them. Like, literally. Want to know what gravity looks like? Watch the dancers fly off scaffolding and land hard on their bellies, or balance impossibly on giant spinning hamster wheels. Seeking a spectacle that demonstrates the principle of inertia? Streb's got you covered: dancers run into walls at full speed, duet with lethal projectiles like steel beams, and generally stomp all over the limits of time, space, and muscle.
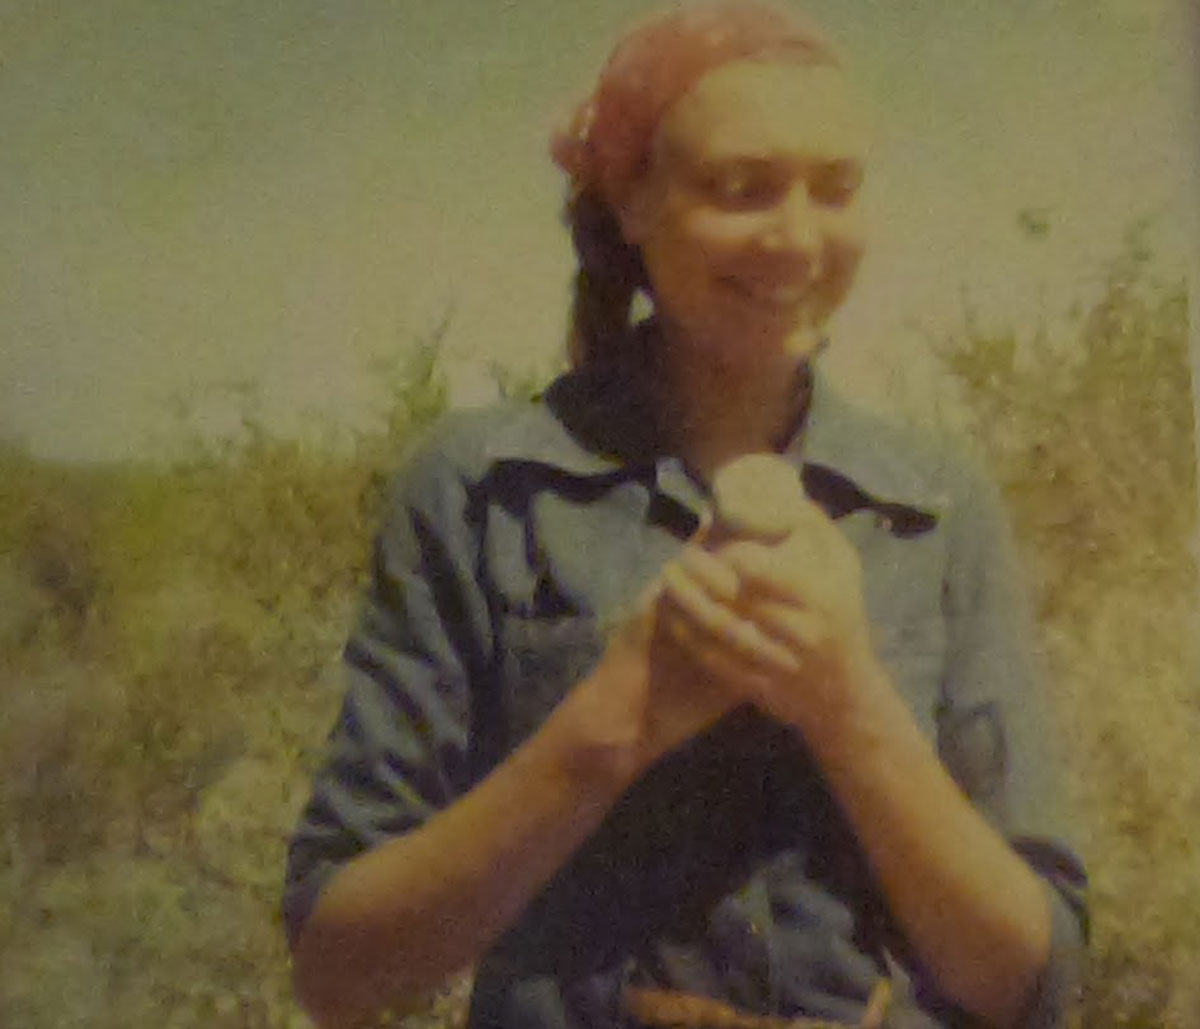
Cities: Rebecca Solnit
With 13 books under her belt, nonfiction writer Rebecca Solnit has made a career out of exposing subtle truths. (Full disclosure: I once worked for her.) Her 2010 book, Infinite City, visualizes the layered history of San Francisco through maps of seemingly unrelated sites: "Monarchs and Queens" overlays the natural history of the monarch butterfly with queer civil rights history. The result is an atlas of previously unseen connections, a shifting paper record of a living city. A New Orleans version, Unfathomable City, is due out in 2013.

Institutions: Anna Schuleit
There’s the invisible, and then there’s theinvisible — the people pushed beneath the narrative because, as Ralph Ellison’sInvisible Man put it, we refuse to see them. When the Massachusetts Mental Health Center closed in 2003 after 90 years of operation, artist Anna Schuleit was commissioned to create a work memorializing the building. Her stunning installation, BLOOM, filled the decommissioned mental institution with 28,000 living flowers paying tribute to the lives that passed through the space.
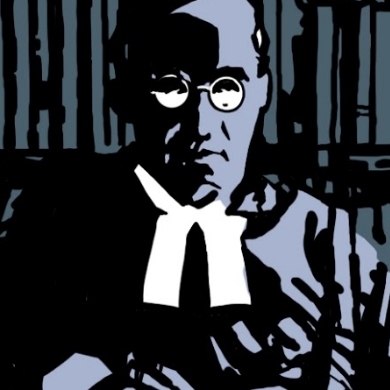
Media: Teju Cole’s Twitter feed
There’s invisible, there’s invisible, and then there’s dead. Novelist Teju Cole, author of Open City, tweets about the news — specifically, newspaper notices of death and crime from 1912 New York. He calls the project “Small Fates." Taken as a whole, Cole's timeline is a chorus of funny/sad ghosts. These are the long-forgotten voices of regular folk — criminals, victims, and reporters — a quotidian citizenry of the city, distilled into poetry.
Did I miss any? By all means list your favorite visible/invisible artworks in the comments. Granted, the question of whether what we see is truly "real" is always open to dorm-room-stoner interpretation. But I'm thinking that art has science beat on this one.
Images: BOMB Magazine, Andrew Kuo, Anna Schuleit